Catch a Ruler, Build a Chart: The Five-Minute Reaction League for KS2
There is something irresistible about a ruler falling through the air. Will you catch it? How fast are you? Who is quickest? That tiny moment of suspense is all you need to start a proper data investigation. The Ruler-Drop League takes a playground-style challenge and gives it a classroom purpose: children measure, record, compare and argue about what the numbers actually mean.
It works because the game is simple enough to explain in a minute, but the maths behind it is not shallow. Once a class has a table of results, you have averages to calculate, outliers to discuss, charts to draw and plenty of chances to ask, “But was that fair?”
Why a falling ruler belongs in a maths lesson
Reaction tests are familiar territory for many children, but the ruler-drop version has a useful advantage: the ruler is already a measuring instrument. The distance it falls before it is caught gives you a number in centimetres. That number is easy to read, easy to record and easy to compare.
It also gives children a physical feel for measurement. A result of 12 cm is not an abstract figure on a worksheet; it is the distance between a partner’s open fingers and the point where the ruler was grabbed. That connection between movement and number is exactly the sort of thing that makes maths stick.
For teachers, the appeal is practical. You need one 30 cm ruler per pair, a pencil and a recording sheet. No tablets, no logins, no printing a booklet. It fits into five minutes at the end of a lesson, a whole-class data session, a wet-break activity or an after-school club.
Setting up the league
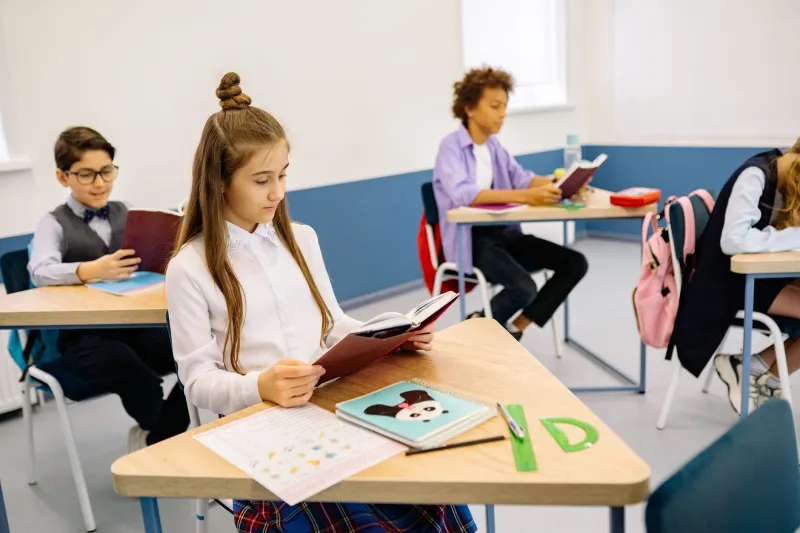
Children work in pairs. One child holds the ruler vertically, with the zero mark level with the bottom of the other child’s open thumb and forefinger. The catcher keeps their hand open, ready to grab. Without warning, the holder drops the ruler. The catcher closes their fingers as quickly as they can and reads the centimetre mark where their fingers landed. Smaller distances mean faster reactions.
Swap roles after each attempt. Give each pair three goes, then record the best result for each child. That “best of three” rule is worth explaining: it reduces the chance that one clumsy attempt or a fit of giggles becomes the headline result.
For a class league, each pair writes both names and both best scores on a shared sheet. You can sort the class into a simple table, or use a large sheet of paper on the wall so children can add their results as they finish. A year-group league works too, with each class sending two or three results to a central display.
The fair-test conversation is the real lesson
Before you start, ask the class what could make the test unfair. This is where the game earns its place in the maths curriculum.
Should the holder use the same ruler every time? Should the catcher sit or stand? Does it matter if the caller counts down or drops without warning? What happens if someone looks away? Should we measure to the nearest whole centimetre or the nearest half centimetre?
Let children suggest rules, then agree on a class version. Write it down. A simple fair-test checklist might include:
- Use a 30 cm ruler with clear markings.
- Hold the ruler at the top, not halfway down.
- The catcher’s hand starts open at the same height each time.
- Drop without warning after the first practice go.
- Record the centimetre mark at the top of the catcher’s thumb.
- Take three attempts and keep the best score.
The rules do not have to be perfect. In fact, a slightly wobbly rule is useful because it gives children something to critique later. “Some people dropped it from different heights” is not a failure; it is a data-handling discussion waiting to happen.
From results to averages and medians
Once the results are in, the league becomes a numbers lesson. Ask each pair to add their two scores to the class table. Then choose a manageable set of questions.
For younger or less confident children, start with ordering: who has the smallest distance? Who has the largest? Can you put five results in order from fastest to slowest? For older pupils, move into averages. Find the mean of the class results by adding all the scores and dividing by the number of children. Then find the median by putting the scores in order and locating the middle value.
This is a good moment to compare mean and median. Does one tell a different story? Is there an unusually large score that pulls the mean upwards? What does that tell us about using a single “average” to describe a class?
Bar charts work well here, especially if you group results into bands: 0–5 cm, 6–10 cm, 11–15 cm, 16–20 cm and so on. Children can draw bars for how many people landed in each band. A pictogram or a simple tally chart may suit younger classes. The key is to move from raw numbers to a display that someone else can read.
Friendly debate, better questions
A league table is fun, but the best maths comes from the arguments around it. Ask children whether the results really show who has the fastest reactions. What else might affect a score? Height, hand size, nerves, practice, tiredness, the surface of the table, whether the ruler was dropped from the very top.
You can also introduce a fairness challenge: if one pair used a different ruler or a different starting height, should their result count? How could we adjust the test next time? This is data handling with a purpose, and it gives children experience of questioning evidence rather than simply accepting it.
For a bit of competition, run a second round after the rules have been tightened. Compare the first set of results with the second. Did the scores change? Did the spread of results get narrower? That simple before-and-after comparison is a gentle introduction to the idea of reliable data.
Keeping it inclusive and low-pressure
Not every child will want to be crowned ruler-drop champion, and that is fine. Emphasise personal bests rather than class rankings. Let children record a partner’s score, check the ruler reading or manage the class chart. Some pupils may prefer to measure the drop using a second ruler or a tape measure, which adds another layer of measurement practice.
For children who find the catching element stressful, offer a two-person recording role or a “measure and check” job. The maths is still there: reading scales, recording accurately, calculating differences and explaining patterns.
A five-minute finish that leaves a mark
At the end of the session, ask each pair to write one sentence about what their data shows. It might be “Most of our class caught the ruler between 11 and 15 centimetres” or “The median was lower than the mean because one score was very high.” That sentence is a small but powerful piece of mathematical communication.
The Ruler-Drop League is not really about finding the fastest hand in Year 5. It is about turning a playful moment into a measurement lesson, a fair-testing discussion and a chart worth reading. And once the rulers are back in the tray, the conversation often carries on: “Can we do it again next week and see if we improve?” That is exactly the sort of question a maths playground should provoke.